Top 3 DeFi Indicators
Market Meditations | March 3, 2021

With the volume of new DeFi projects in the space, it can be difficult to ascertain the “intrinsic” value of DeFi assets. We’ve turned our attention to how our readership can best determine whether a protocol is overvalued or undervalued. Free resources we have created on this topic so far: On Chain Analytics Guide and Project and Financial Metrics Guide. Today, we look at more commonly used indicators to value DeFi projects. None of these indicators in isolation are definitive ways to calculate valuation. Use them in combination with other indicators, however, and you might just build an edge in the market.
1️⃣ Total Value Locked / Fully-Diluted Market Cap
Total Value Locked (TVL) represents the amount of assets that are currently being staked in a specific protocol. With the argument going that the higher the value locked up in a DeFi DApp (decentralized application), the better.
GETTING STARTED. To find data on TVL, DeFi Pulse (defipulse.com) is a great resource and starting point.
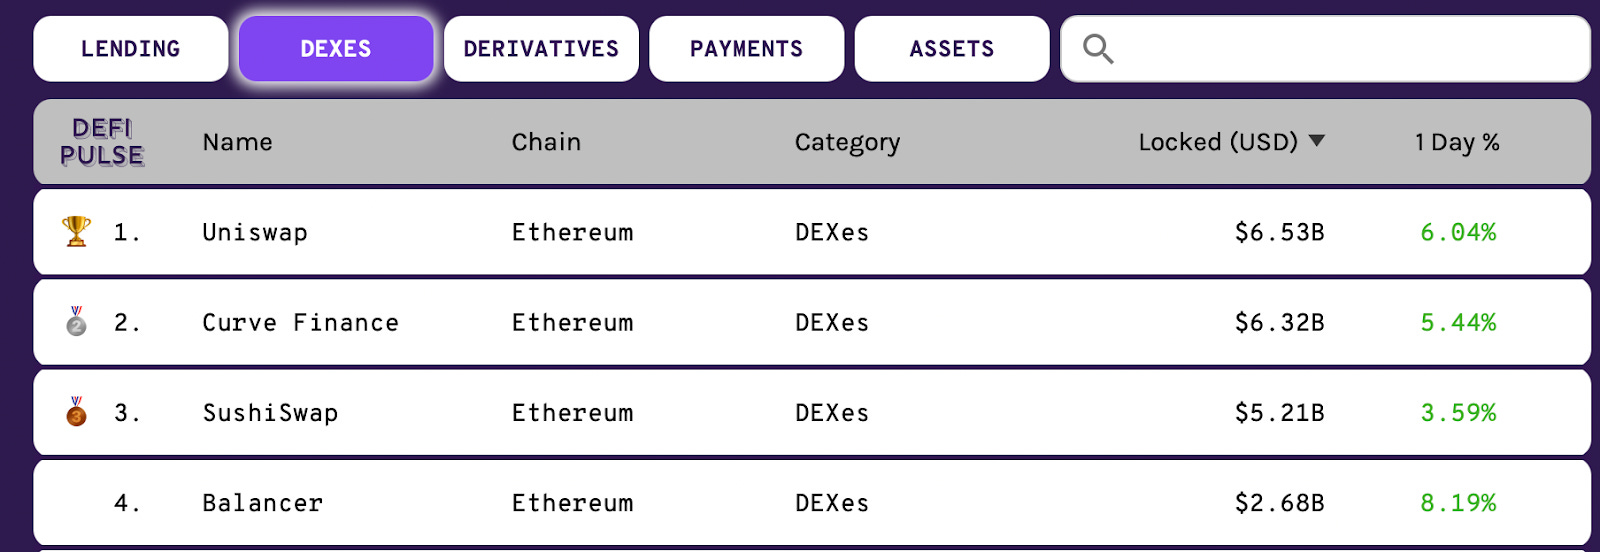
The ‘locked’ data point displays the total number of BTC, ETH or DAI being used in the DeFi ecosystem and the homepage lists all of the protocols and their ranking by TVL. For each protocol, by clicking on the relevant name, you can find key growth stats, charts, a summary of the application and relevant links (including audits).
FURTHER RESOURCES. CoinGecko (https://www.coingecko.com/en/defi) also provides TVL data and for those who are in the business of using excel or google sheets to track their investments, here is a resource that provides TVL in Google Sheets for data analytics purposes, allowing you to create your own live TVL tracker.
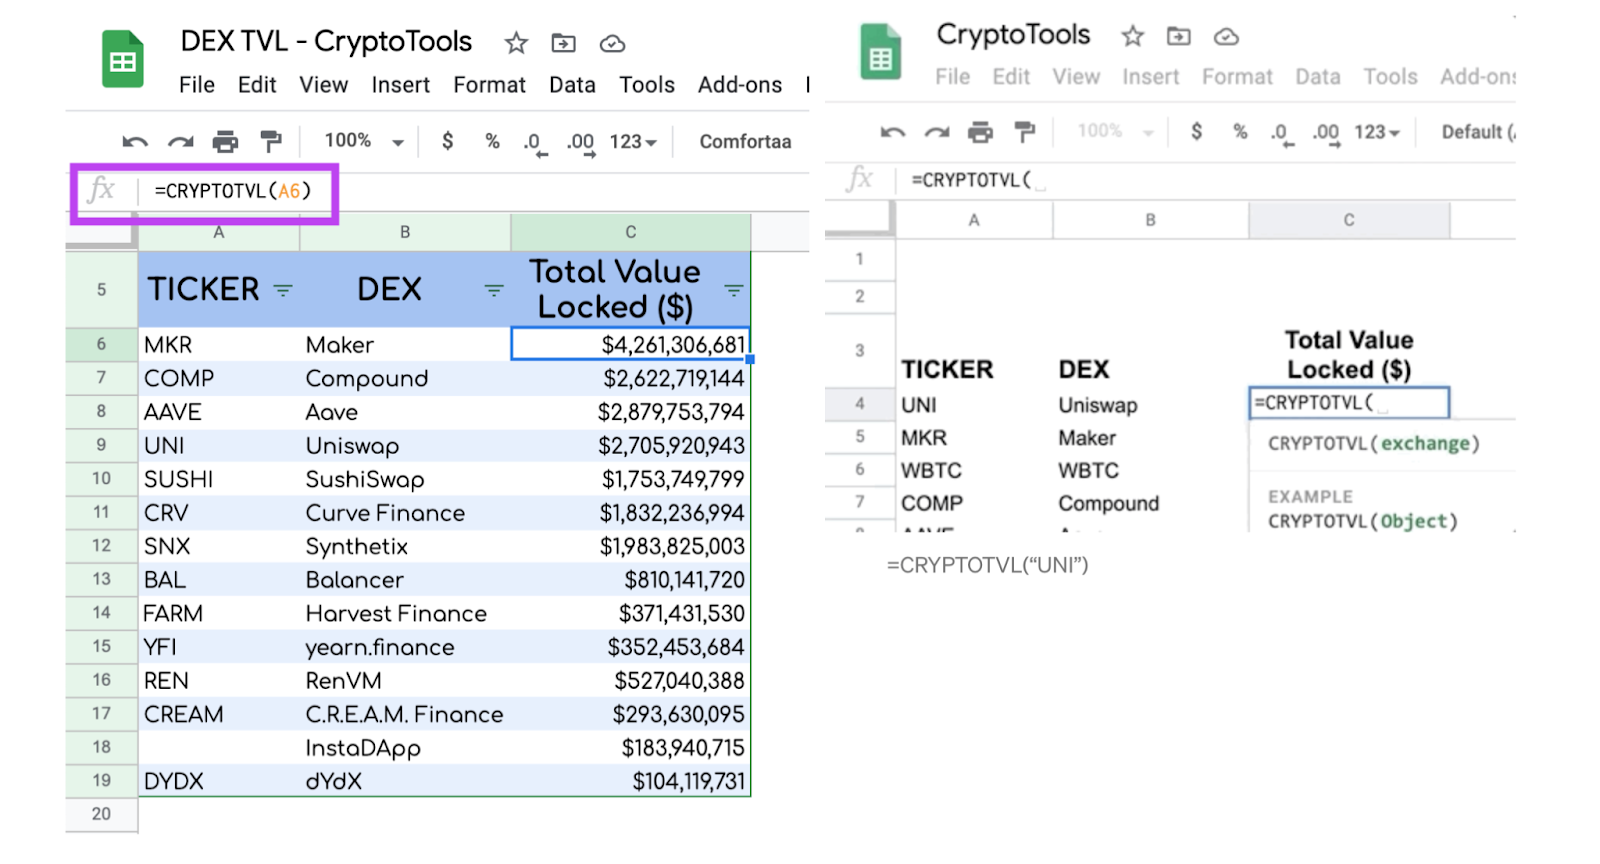
Source:https://medium.com/coinmonks/google-sheets-analytics-total-value-locked-in-defi-33b926c18a9f
We mentioned that TVL represents the amount of assets that are currently being staked in a specific protocol. On Wednesday, we’ll be releasing a full guide on what staking is and a step by step of how you can start earning yields through staking. To make sure you receive this guide, join our free Market Meditations community:
2️⃣ Price-to-sales ratio (P/S ratio)
In legacy markets, the price-to-sales (P/S) ratio is a valuation ratio that compares a company’s stock price to its revenues. It is an indicator of the value that financial markets have placed on each dollar of a company’s sales or revenues.
DeFi protocols also generate revenue. If you are curious about the revenue generated by different networks and protocols, you can find this information here, organised by the 1 Day and 7 Day averages. Since many DeFi protocols already generate revenue, a similar metric to the P/S ratio can be used for them as well:
Crypto P/S ratio = (Market Capitalisation of the Protocol ÷ Revenue)
The basic idea is that the lower the ratio is, the more undervalued the protocol may be. In the case of Ethereum, Grayscale reported back in February 2021 that Ethereum was undervalued from a P/S ratio perspective. Ethereum’s P/S ratio at the start of 2021 was the lowest it has been for over 3 years at around 0.02.
“A lower ratio indicates that the network is generating high revenue relative to Ether’s historical market capitalization, and thus may be undervalued”.
GETTING STARTED. TokenTerminal (https://terminal.tokenterminal.com) provides data on Price-to-Sales ratios. Below is a screenshot that demonstrates Grayscale’s point on Ethereum’s low P/S ratio relative to its market capitalization.
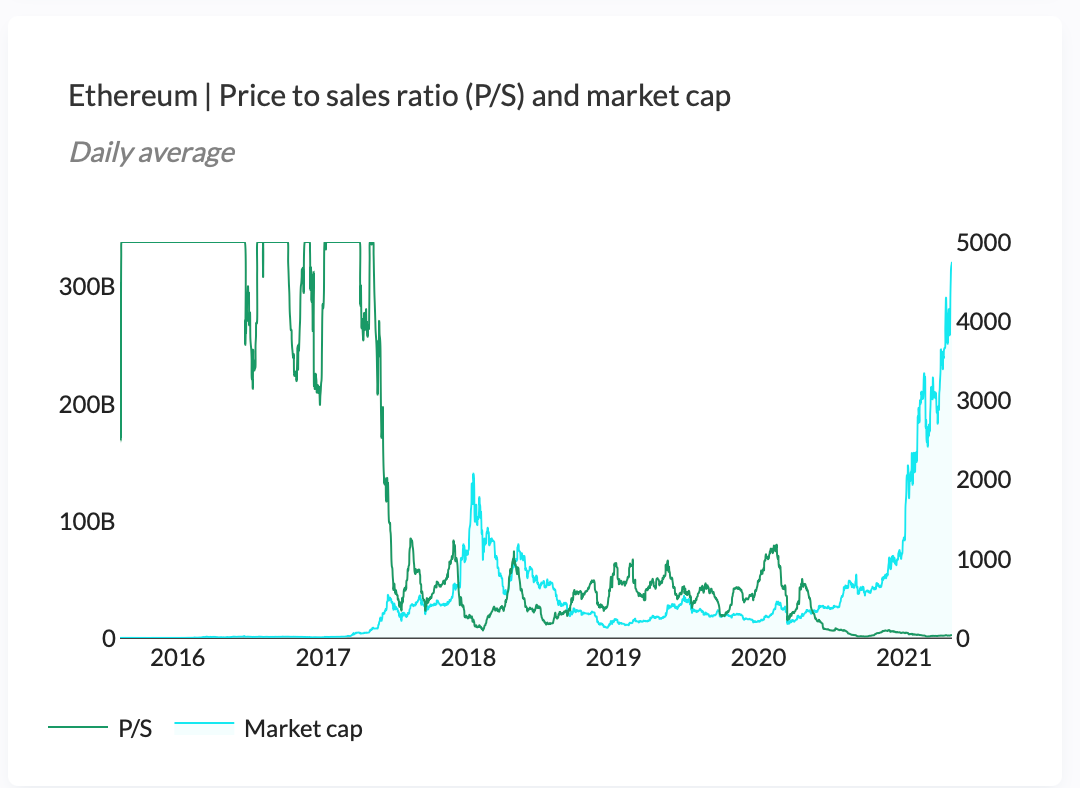
Source: https://terminal.tokenterminal.com/dashboard/Price-to-sales
3️⃣ Token Supply and Balance Change on Exchanges
We were fortunate enough to get Ki Young Ju, founder of CryptoQuant onto the Market Meditations podcast. Full episode here. He explained how we can read token supply and balance change on exchanges to understand market dynamics. It all comes down to supply and demand:
- BTC reserves (supply) on exchanges -> indicates selling pressure -> downward trend. The idea being that since holders and whales aren’t holding their funds in their own wallets, it could be likely that they are looking to sell them.
- Stablecoin reserves on exchanges -> indicates demand pressure -> upward pressure.
GETTING STARTED. There are a range of resources available to access this data. Albeit, not all are free. For Bitcoin and Stablecoin flows, you can access some data from CryptoQuant for free.
Free link for BTC Exchange Flows:
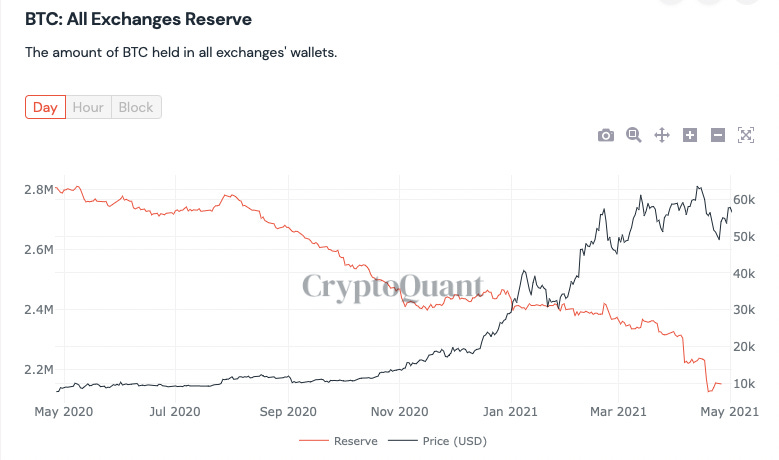
Note exchange reserves of BTC are still declining, suggesting demand remains high.
Free link for Stablecoin Exchange Flows.
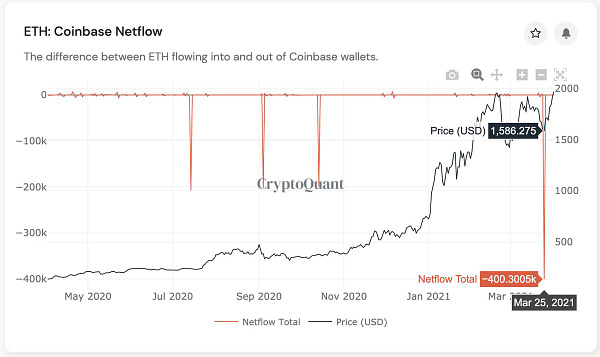
You can also follow Ki Young Ju and CryptoQuant on twitter for free and regular charts and updates. We previously mentioned Grayscale’s monitoring of Ethereum via the P/S ratio and so too did Ki indicate increased demand for Ethereum last month using exchange outflows:

400k $ETH flowed out from Coinbase a few days ago. Speculative guess, institutions are now buying $ETH. cryptoquant.com/overview/full/…
FURTHER RESOURCES. Other resources are available at nansen.ai and glassnode.
